Easy Insight Logo
Call 1-(720)-316-8174

COGS Analytics in Easy Insight

This functionality is currently available for Cin7 Core and Cin7 Omni. It will be expanded to Katana and OrderTime next, with other systems coming soon!

Cost of Goods Sold reflects the cost of your products--how much did it cost to buy or build the product that you're selling? COGS analytics in Easy Insight enables you to go beyond that single COGS number and break out the COGS of a particular order into its origin components:

  • Base purchase cost
  • Purchase freight
  • Purchase duties
  • Other purchase costs
  • Stock adjustments, including initial stock adjustments
  • Manufacturing costs

Based on what's available in terms of cost layer data in your inventory management system, these fields will be automatically populated for you.

Since we're just now rolling out this functionality, you will currently need to request to access to this functionality for yor account from support@easy-insight.com.

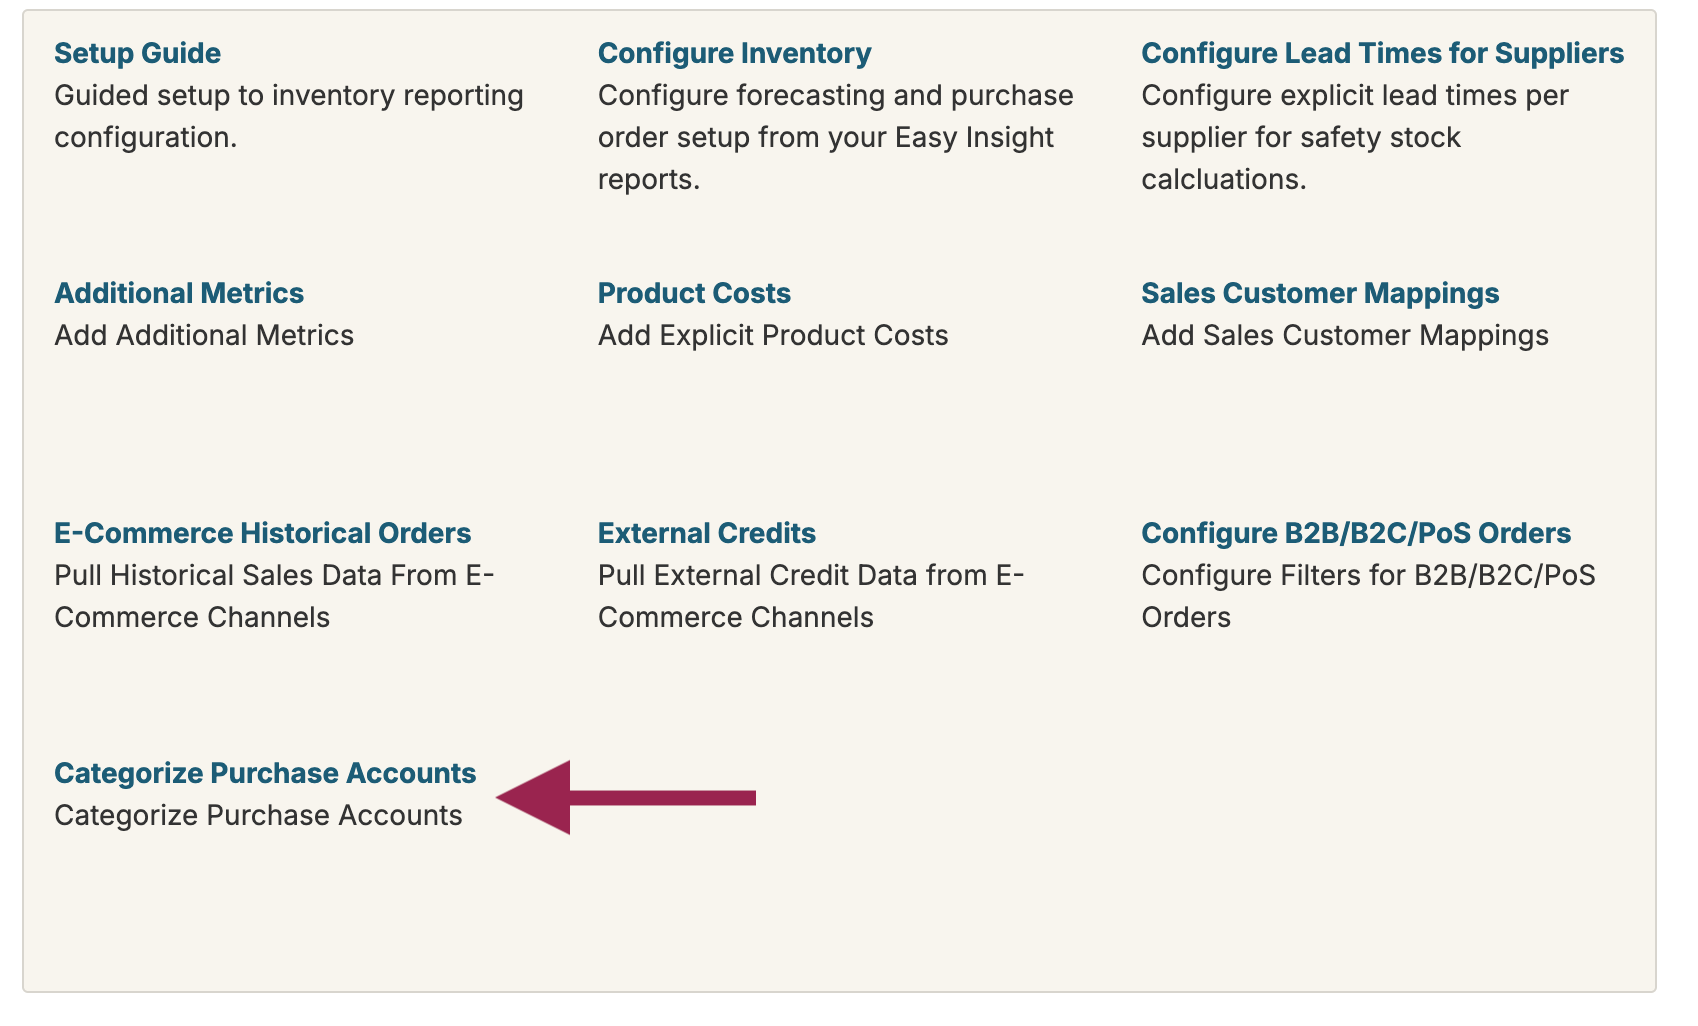
For Cin7 Core, you can configure costs by account by going to the Inventory section of the data source and clicking on Configure Purchase Accounts:

We recommend using manual journals on the purchase order to attribute costs, but you can also pull the costs out of the additional charges on your purchase order--accounts used in both journals and additional charges will show up in the list of available accounts:

Once configured, save and refresh the data source to generate your COGS Analytics data. A series of prebuilt reports are available to help you use this data. The following prebuilt reports are available to help you use this COGS analysis data, located under the Margins sections of your dashboard:

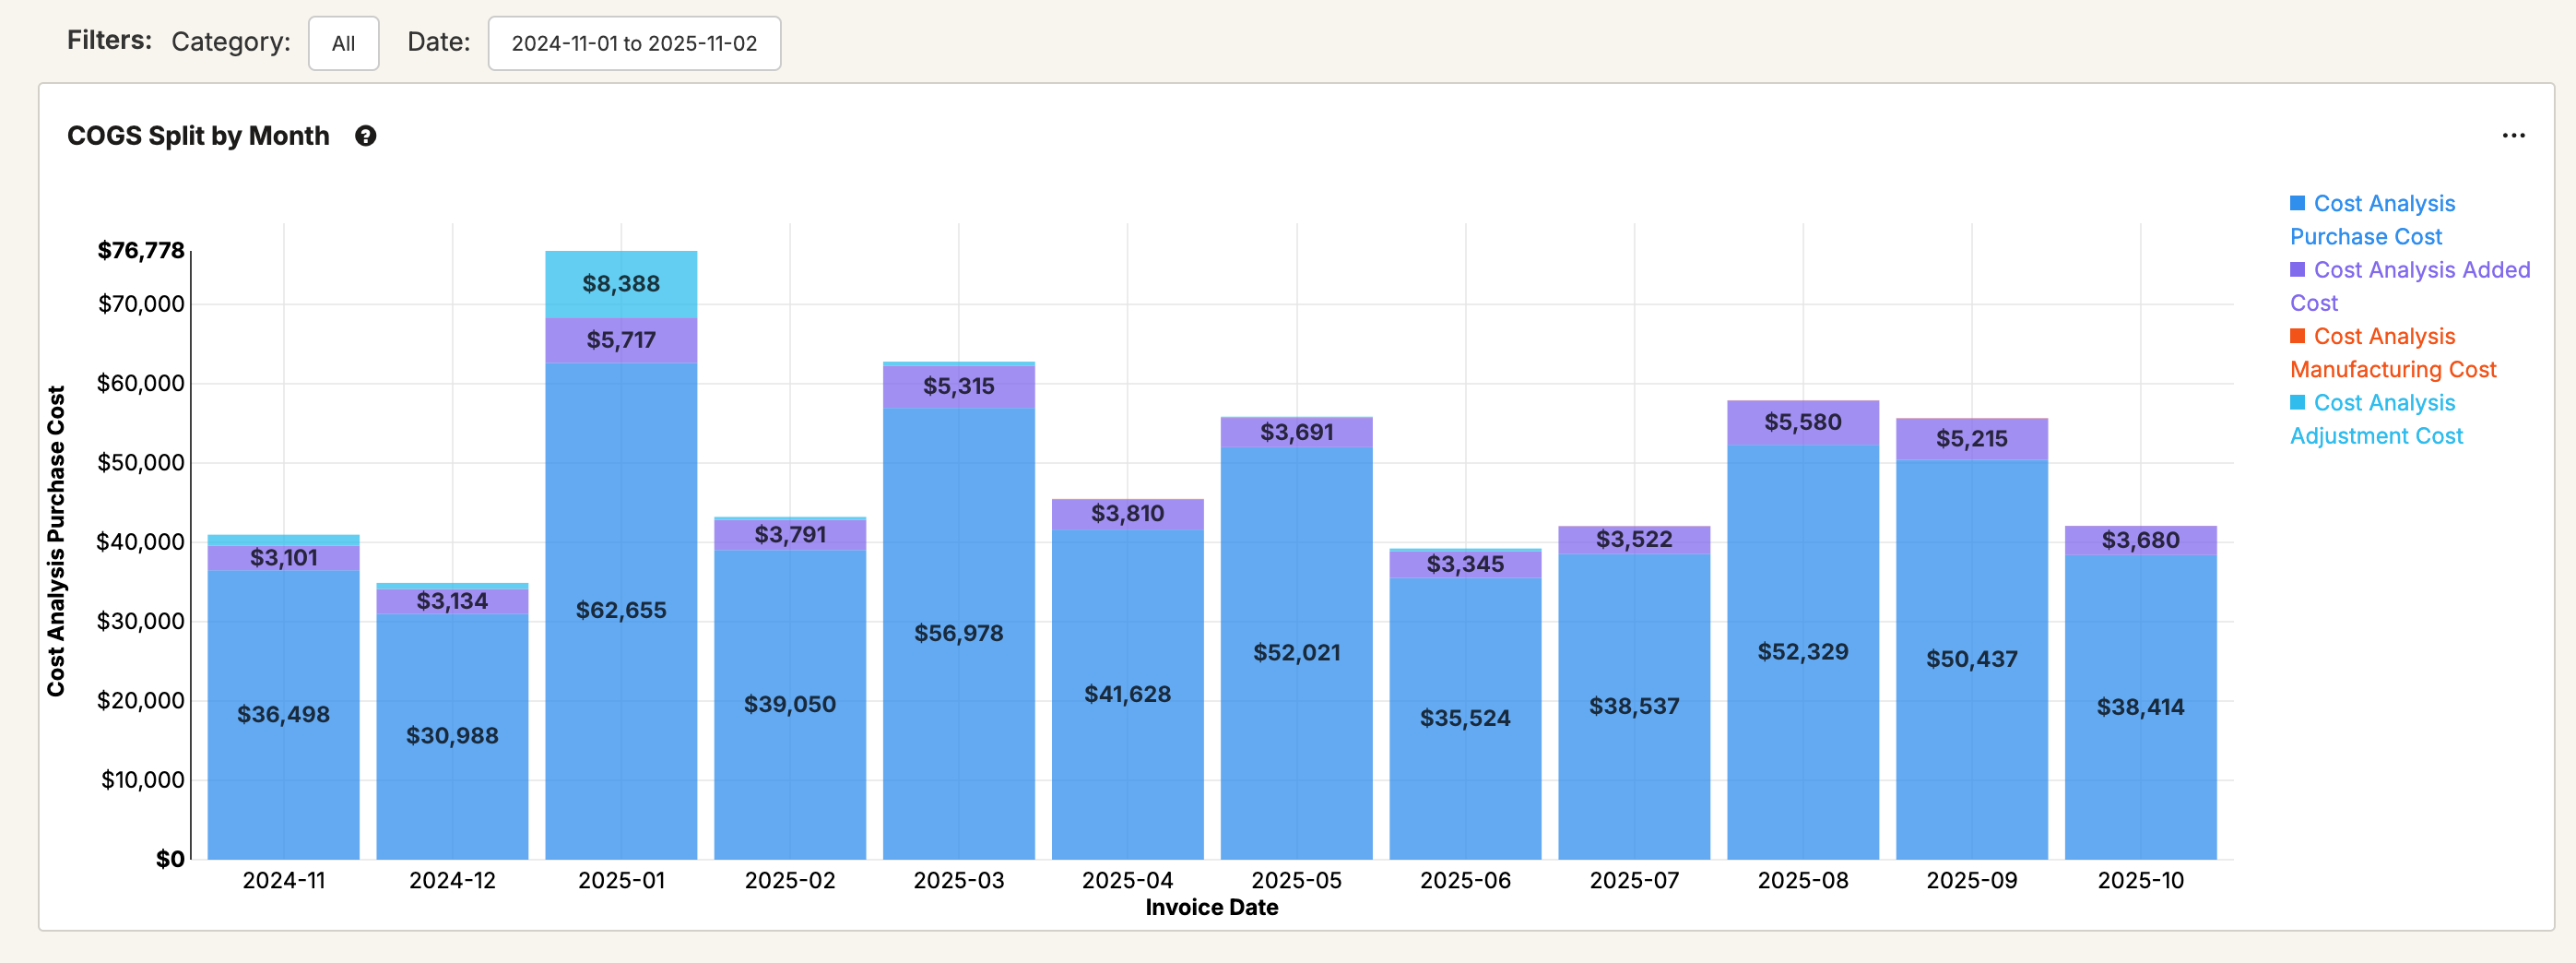
COGS Split by Month shows you the monthly COGS of your shipped orders split out across the different categories. You can capture exactly how changes in duties are affecting your COGS, how manufacturing process changes are affecting costs, and more.

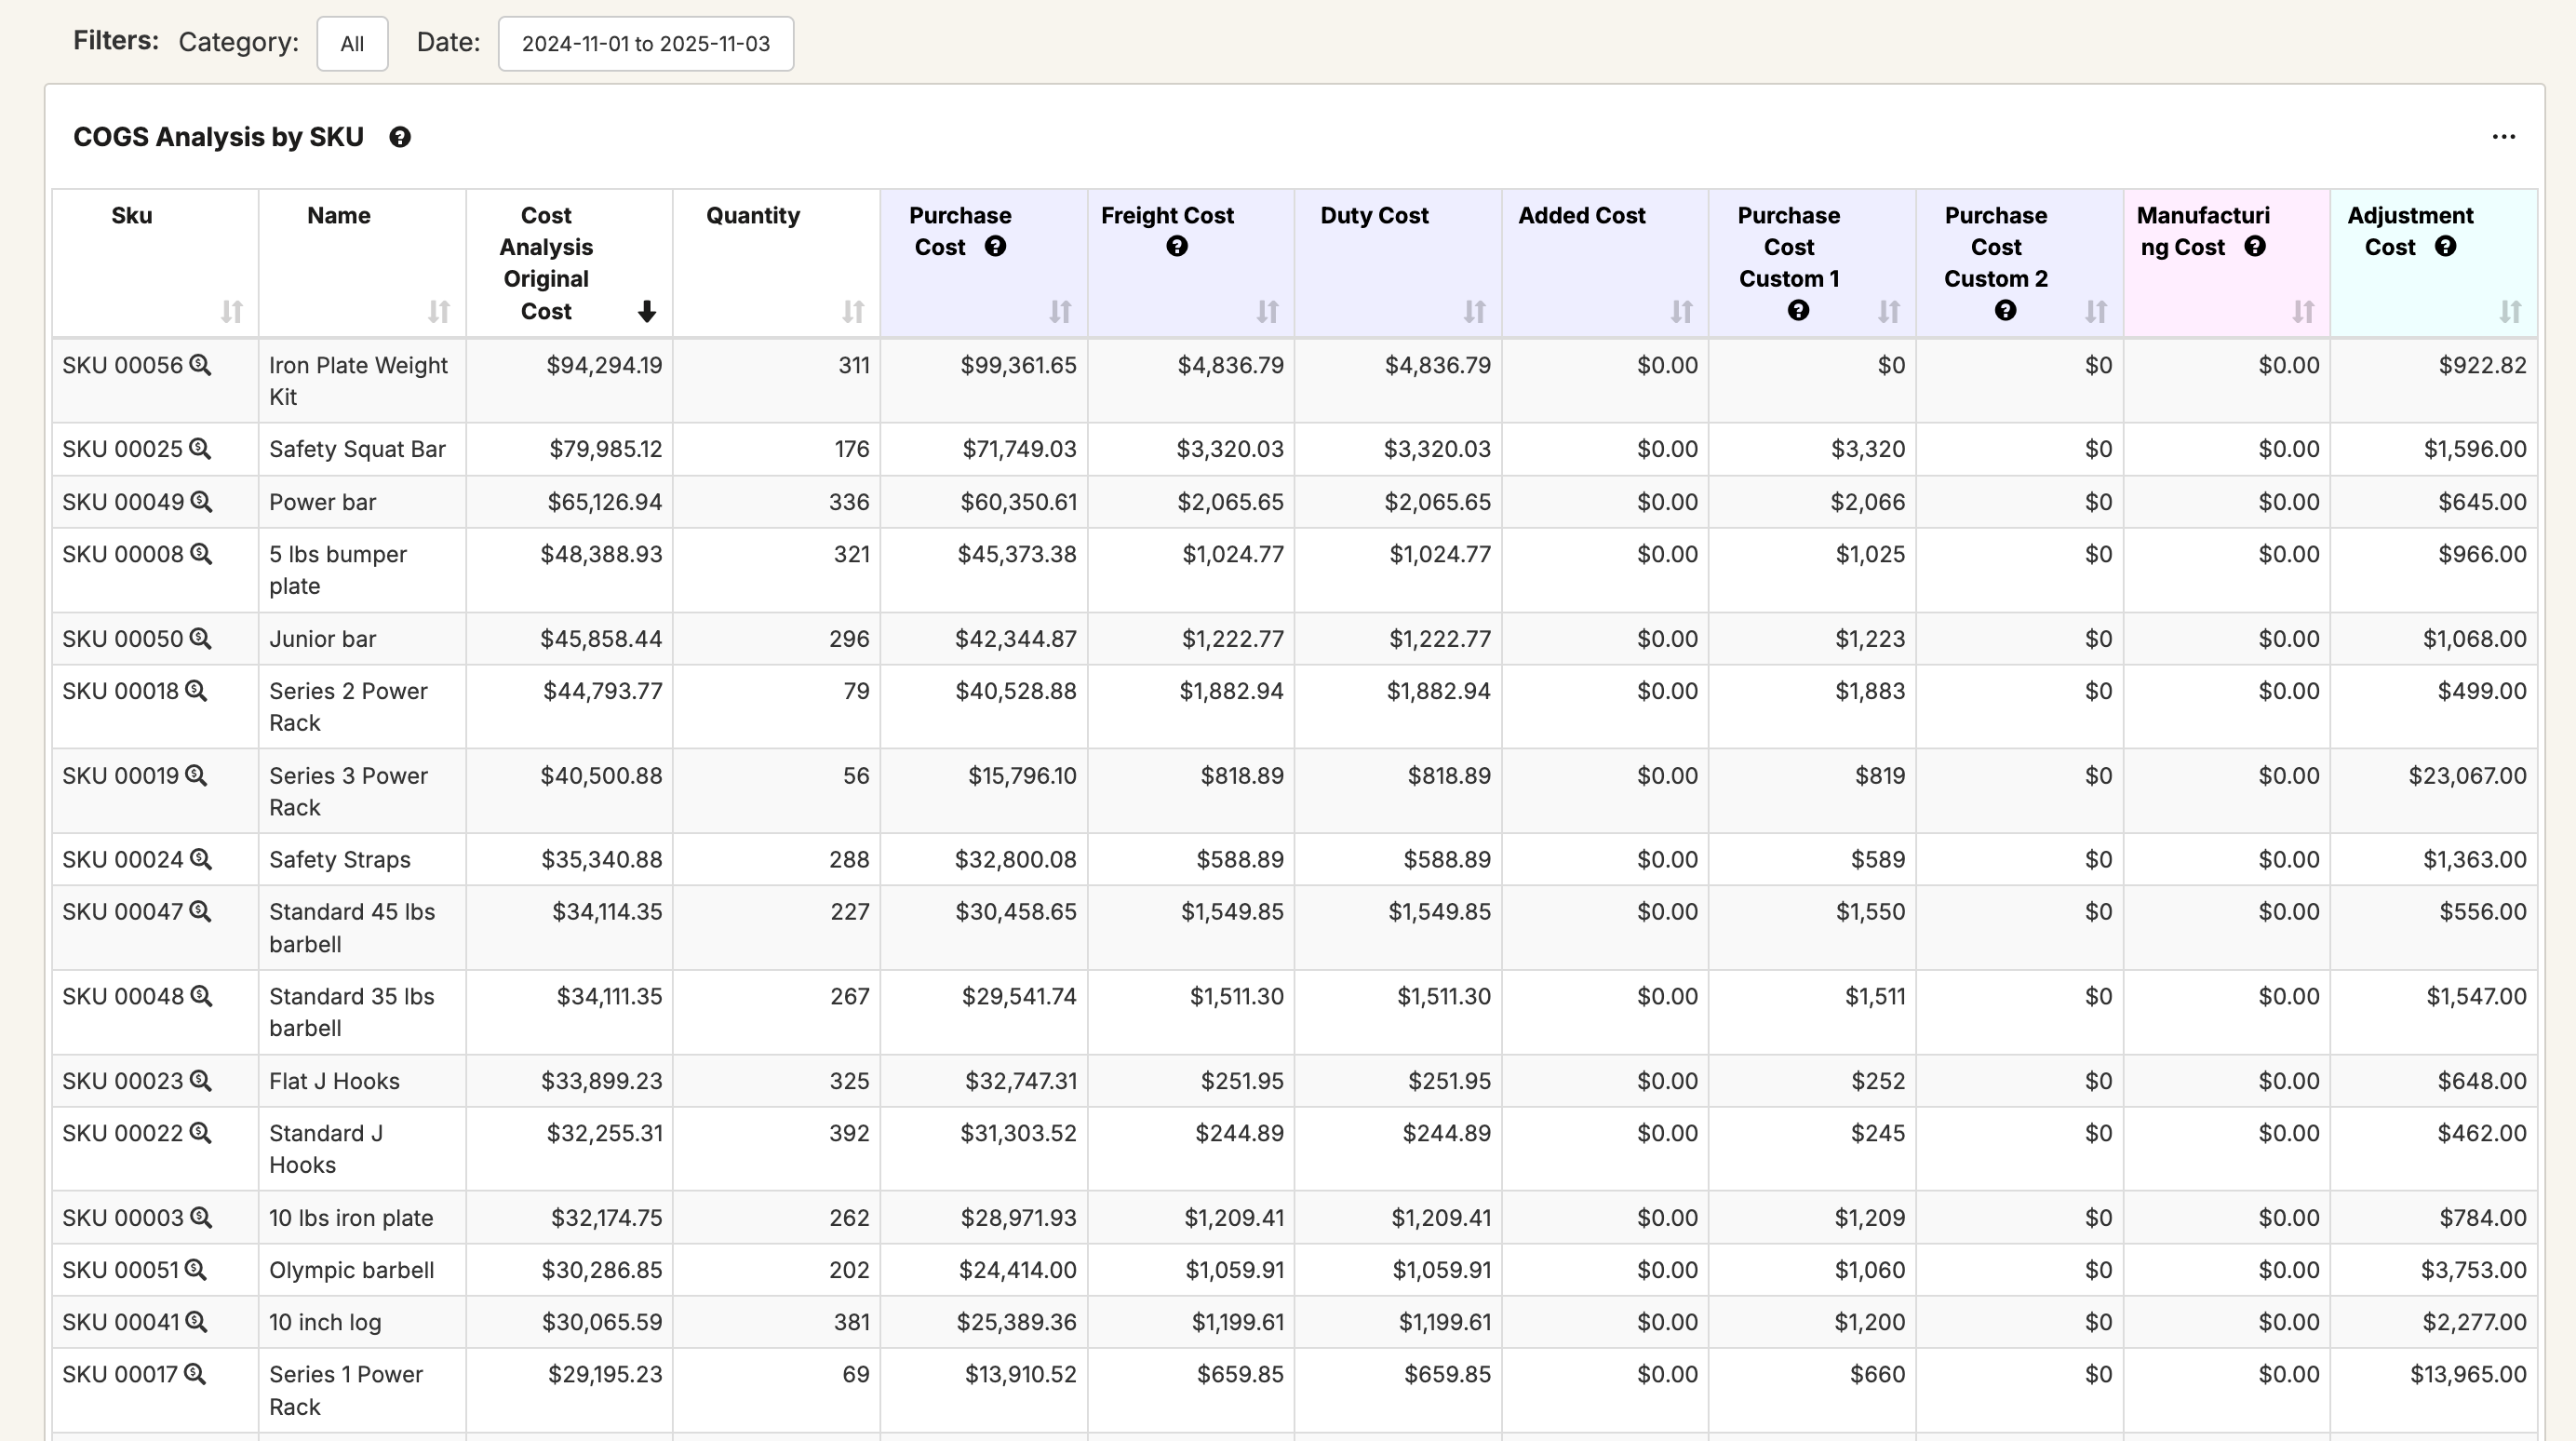
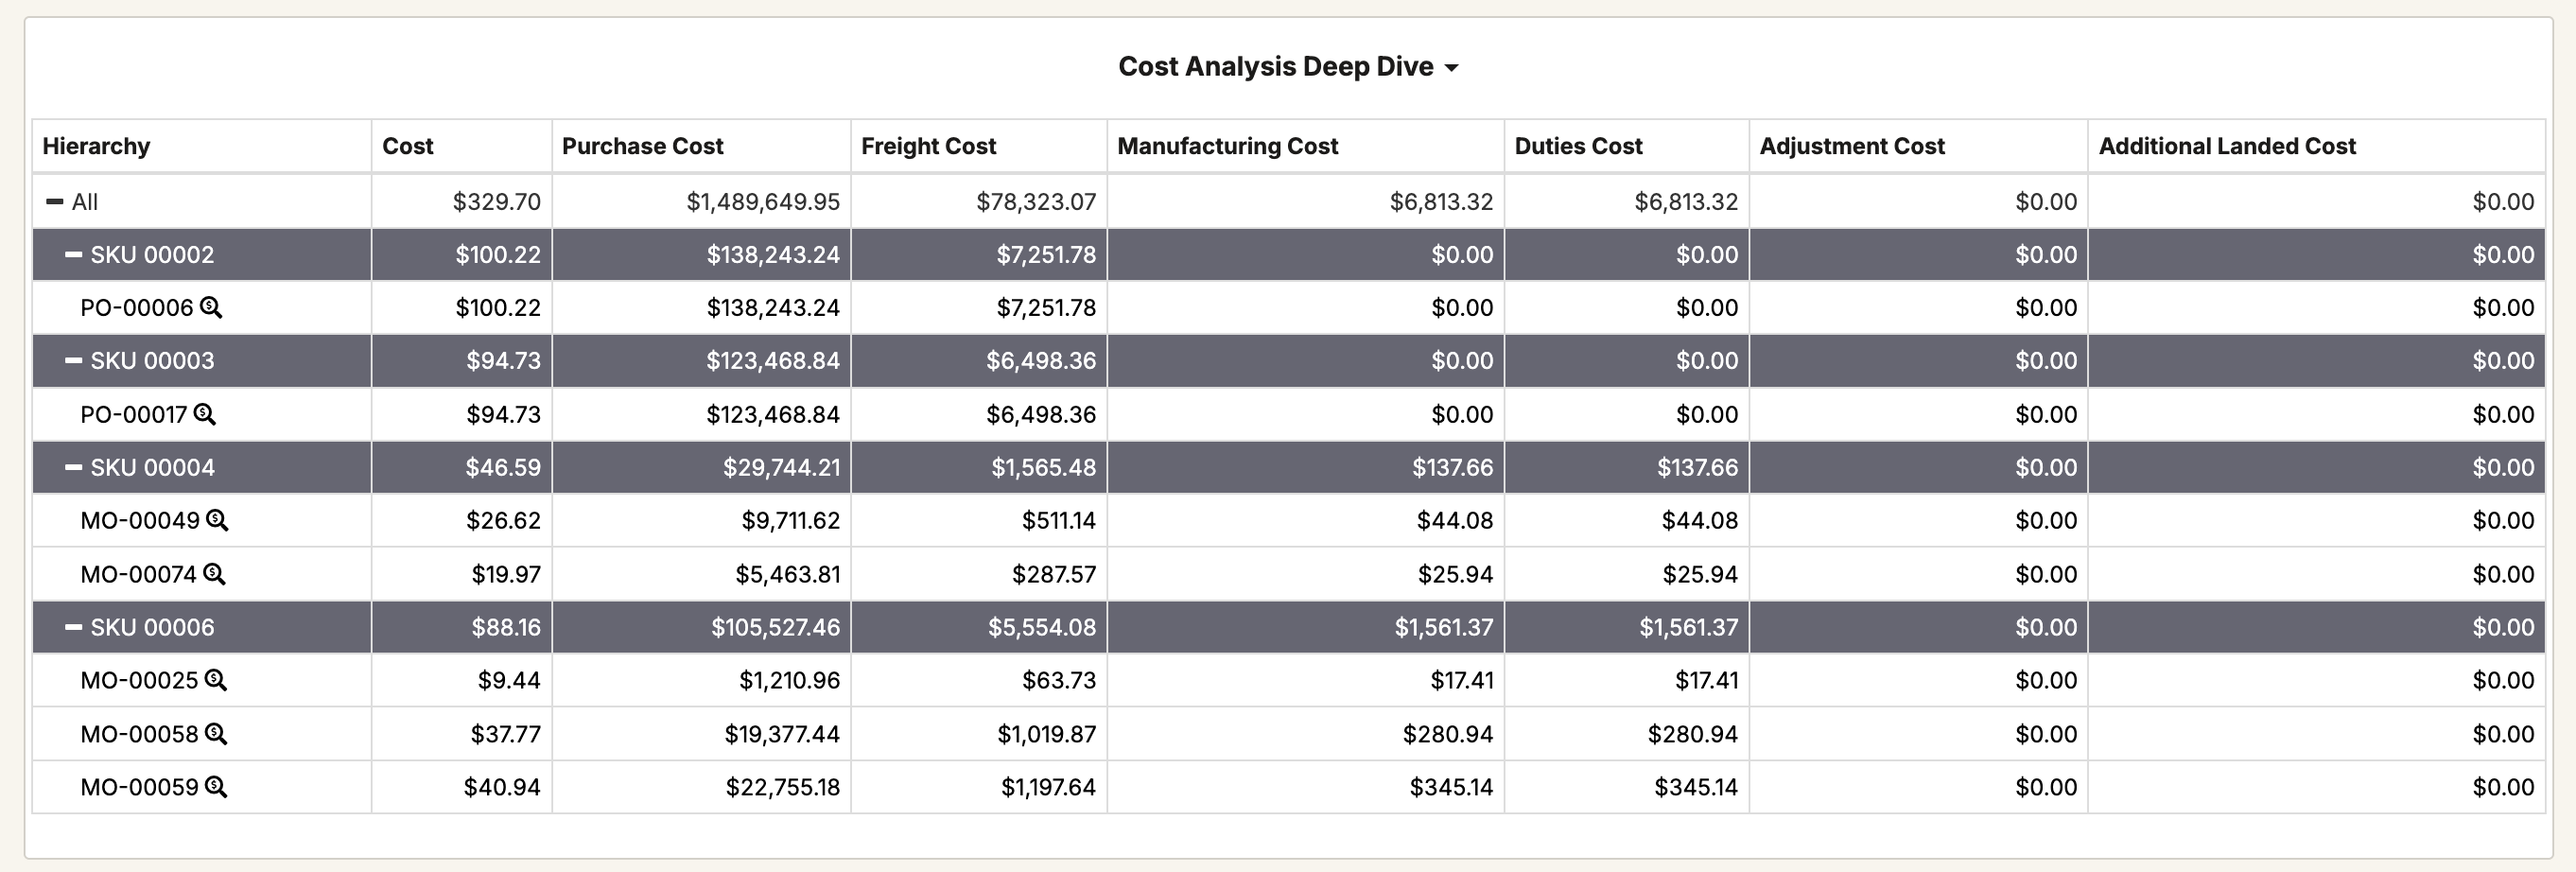
COGS Analysis by SKU breaks out the cost of each SKU across the different categories. You can use this view to look for products with particularly high purchase overheads or manufacturing overheads to help identify build vs. buy decisions or finding alternate suppliers.

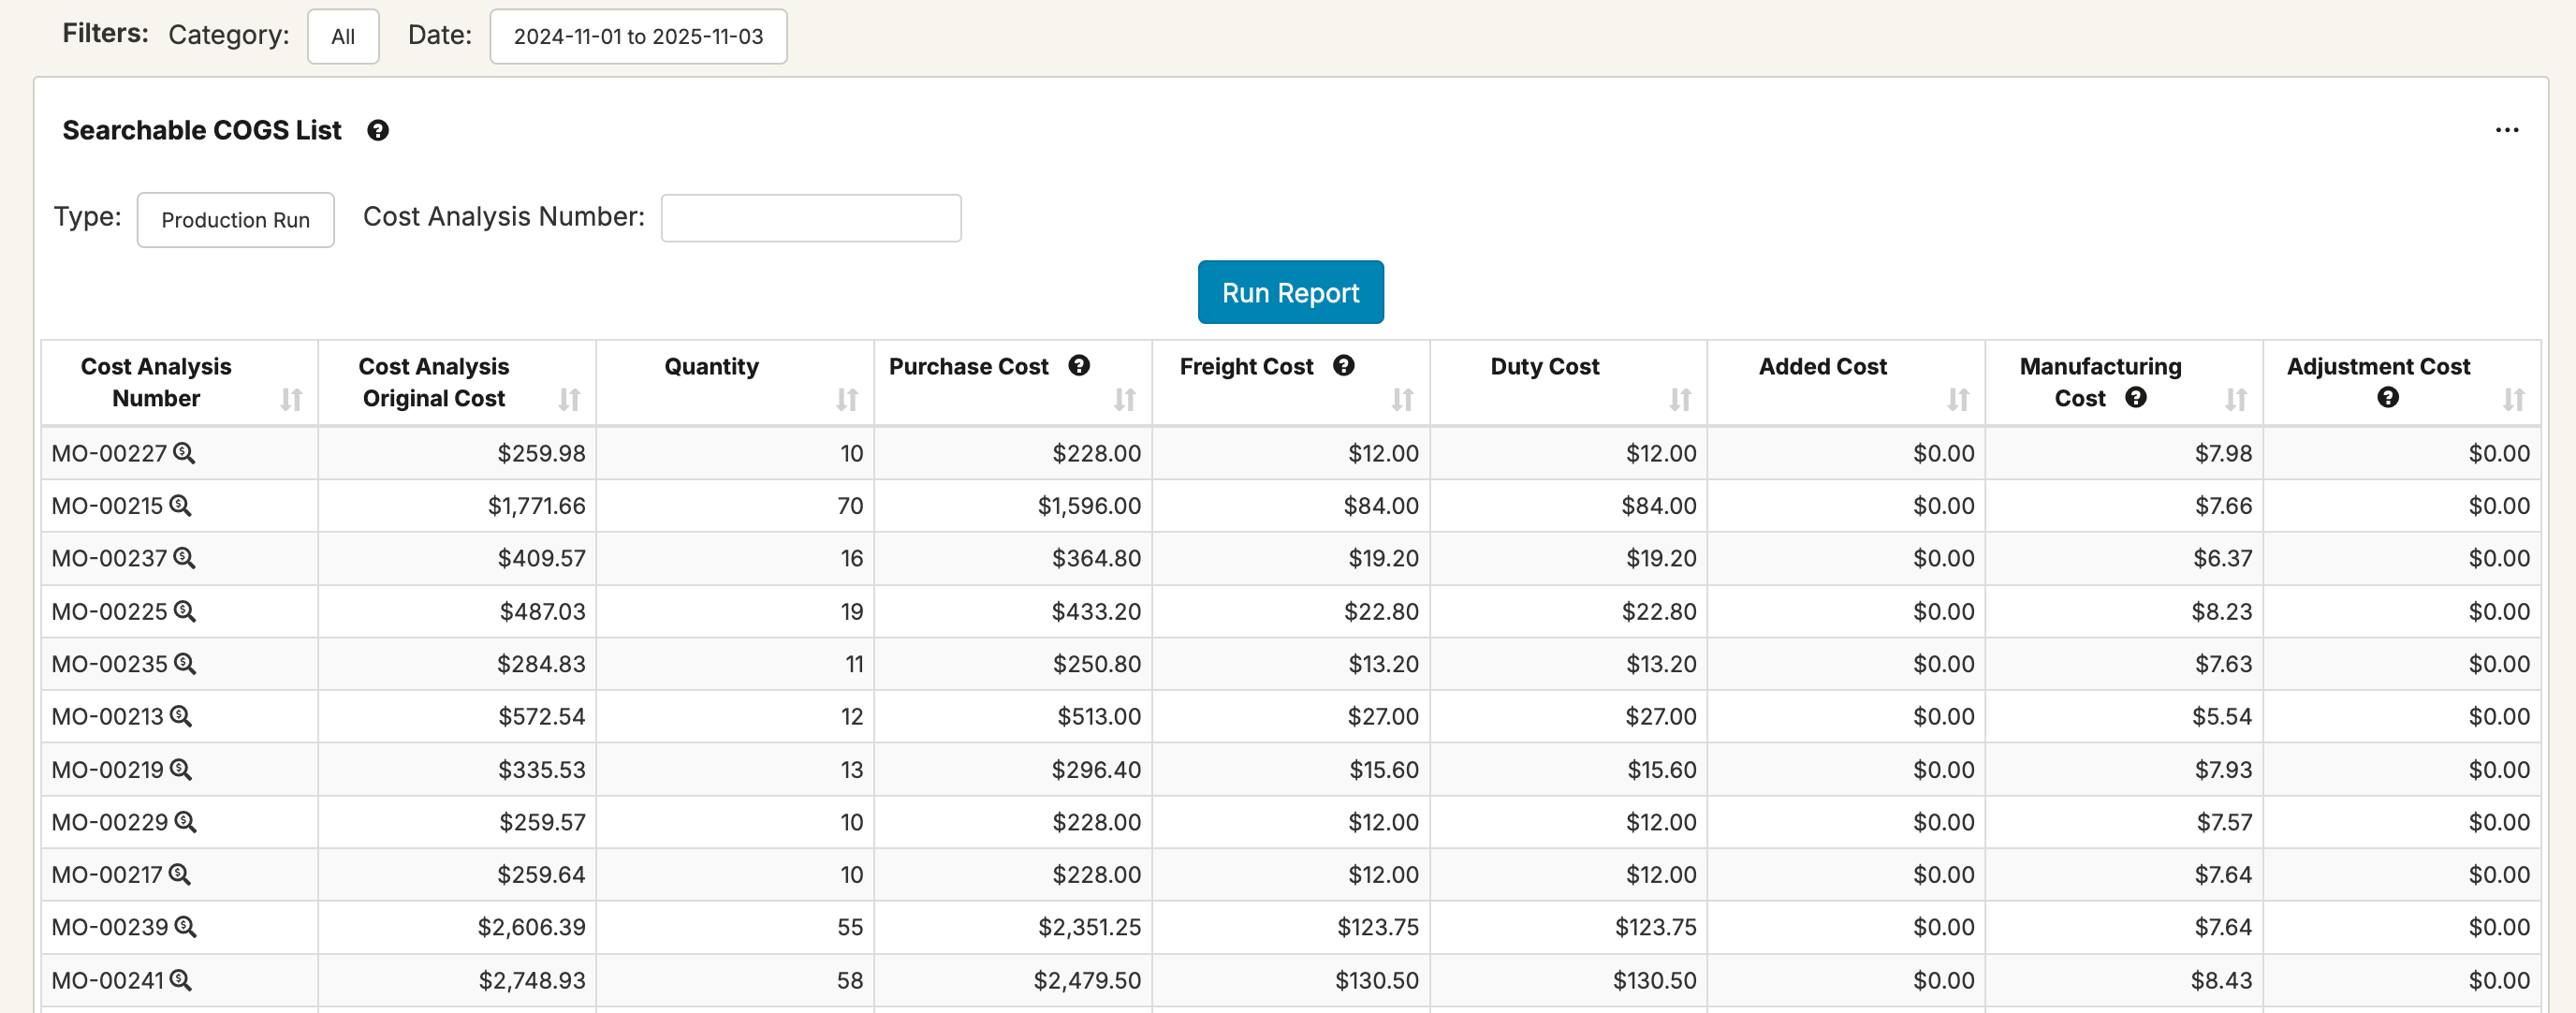
The Searchable COGS List lets you pull up a specific order, whether sales, purchase, production, or anything else, and dig back into the component costs of that order. You can click on an order, then continue to click back through multiple levels of BOMs to keep navigating through the different cost layers.

COGS for Sales Orders let you identify orders in a certain gross margin range and dig back into the costs driving that margin. For example, you could find shipped orders with $0 orders and identify where that $0 came from, since it might have been for a misconfigured purchase order or an issue with a manufacturing order.

For any of these reports, you can click to drill in and go through the cost layers. For example, clicking on a sales order with $0 COGS in this case shows the initial stock take that the product came from, which looks to have been set with an incorrect $0 amount:

If you click into a product that's manufactured, it'll show you the different components that went into manufacture:

And as you click on those components, it takes you on back further into the components that built those components, working back through your bill of materials to the original purchases or stock takes:

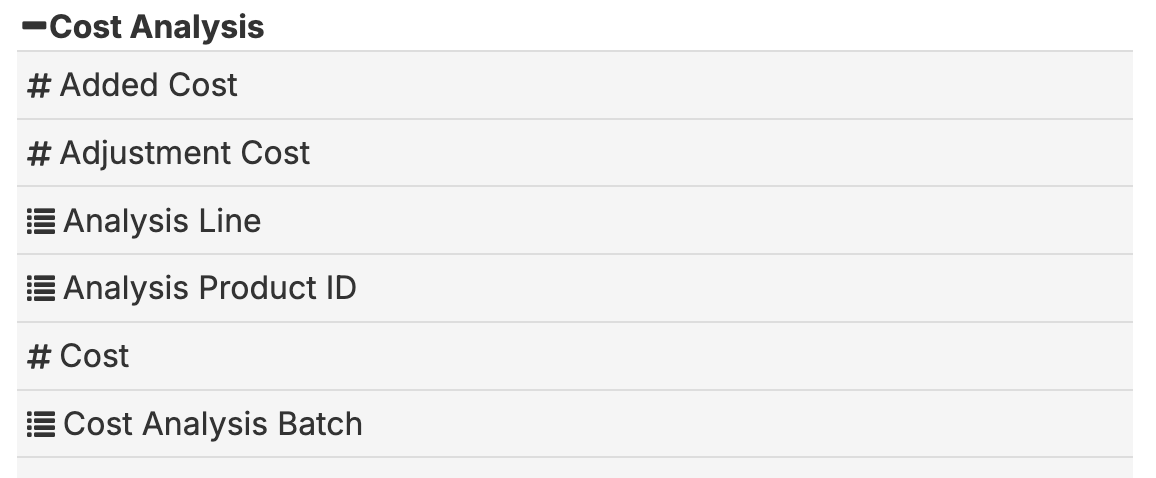
You can also create custom reports on the data. You'll find the fields under the Cost Analysis folder:

Twitter Logo